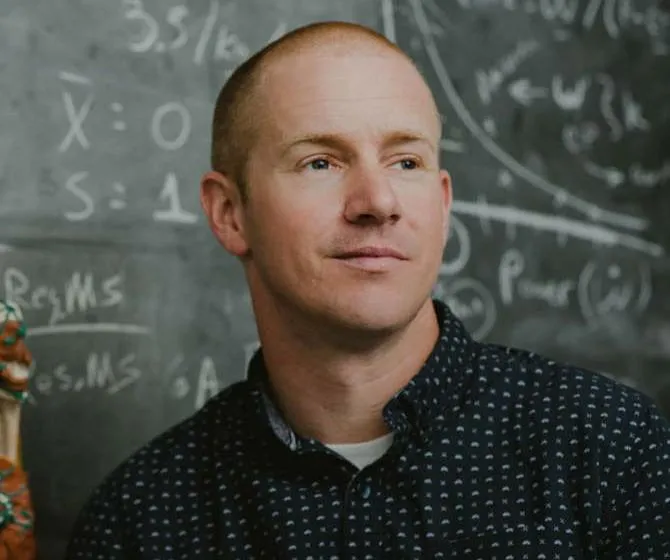
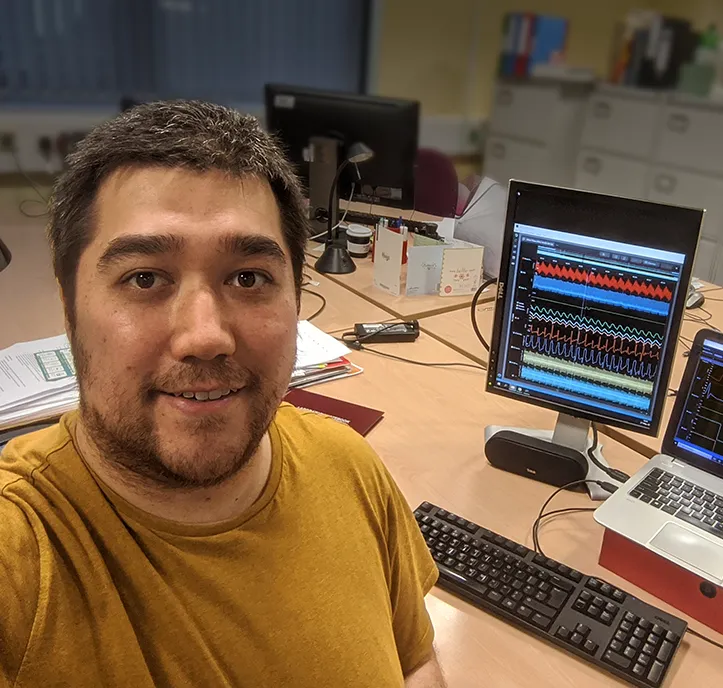
In this free on-demand webinar, PV loop experts DeWayne Townsend (DVM, Ph.D.) and Adam Goodwill (Ph.D.) discuss how to collect and analyze high-quality pressure-volume loop data.
Join the discussion: Our team of Instructional Designers share and discuss two articles on how race is portrayed in medical education. Both of them have been published in Academic Medicine and are free to download.
Professor Tony Macknight shares the story behind our latest Lt Collection, Understand Your Physiology - Plus helpful tips for integrating the learning resource into your physiology course!
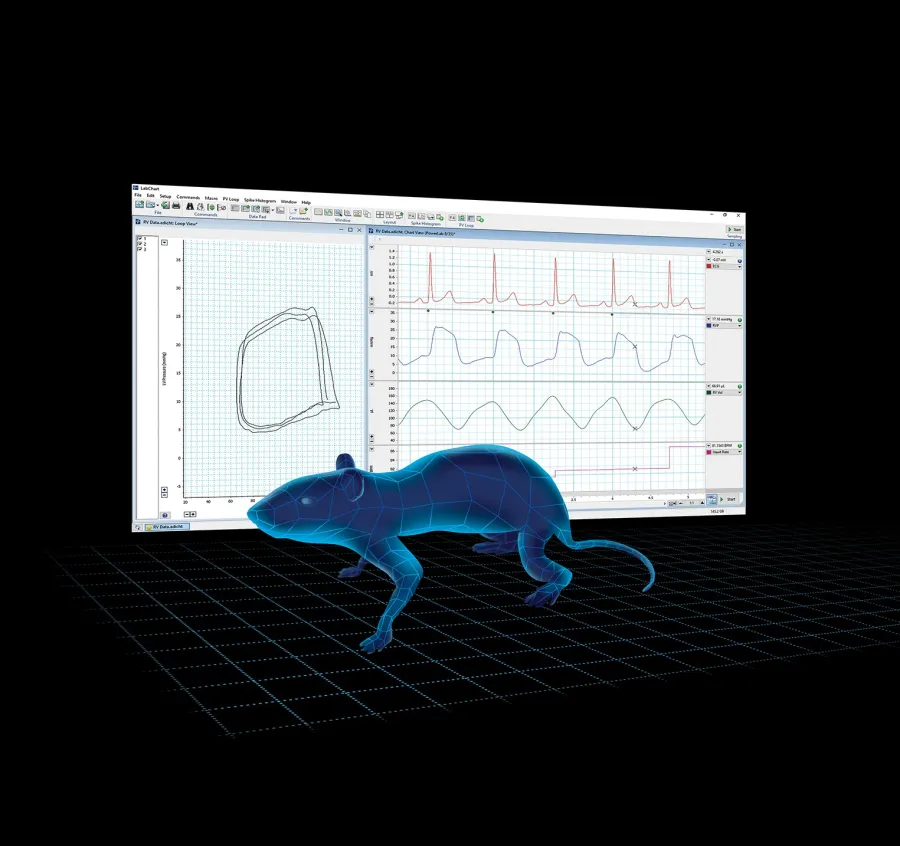
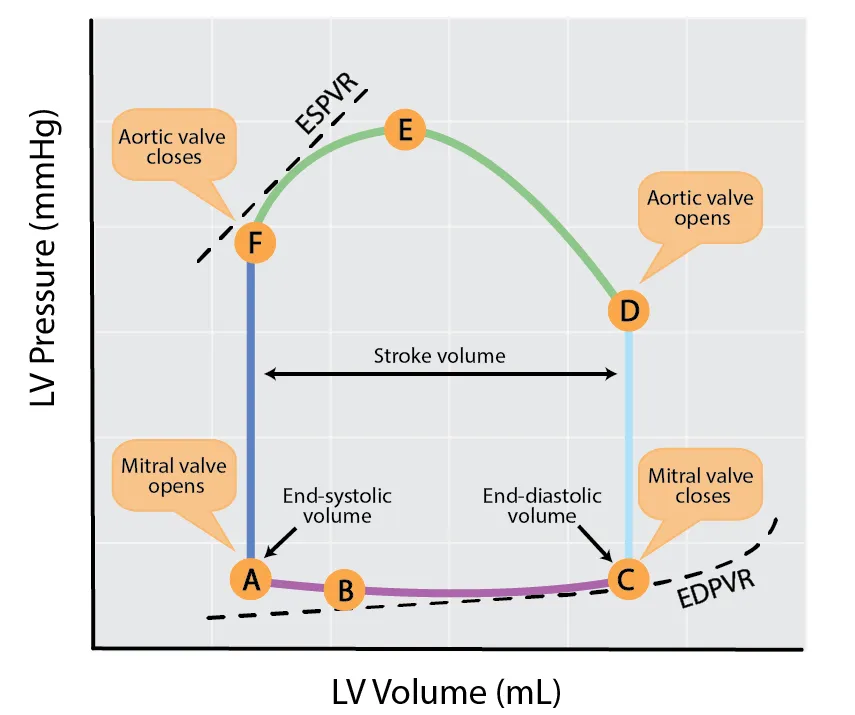
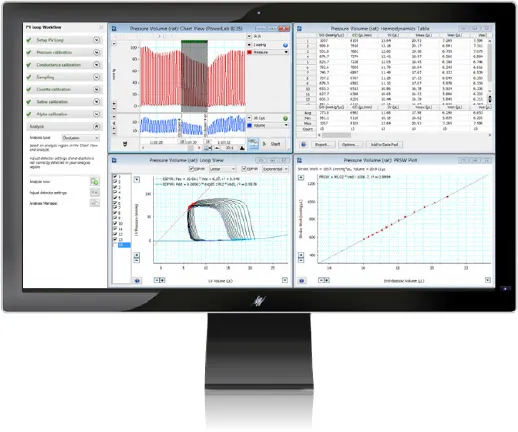
Cardiovascular Physiologist Adam Goodwill (P.h.D) provides an introduction to the pressure-volume loop, how it compares to other techniques, plus tips for interpreting measures of cardiac function.
Cardiovascular Physiologist DeWayne Townsend discusses common sources of signal variability, experimental considerations and expert tips for collecting high-quality PV loop data.
Associate Professor Tina Hinton shares her experience of having to make the swift transition from face-to-face teaching to a fully online lesson and lab delivery during the Covid-19 pandemic.
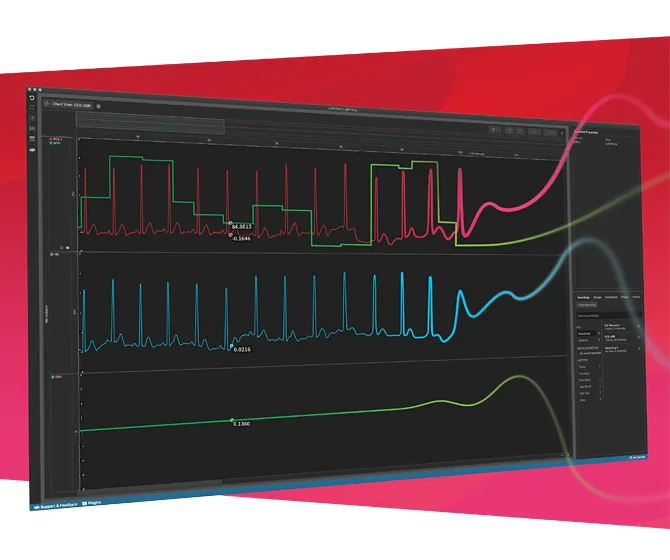
Keith Siew was tired of the inefficiencies in his data sampling and analysis tools - he wanted a platform that could do it all, from end-to-end. That’s where LabChart Lighting has helped...here he explains how
During the Covid-19 quarantine, Marc Demolder has continued to teach practical physiology labs by remote, using Lt. Here are his top pieces of advice for successful online labs...
Early Adopter, Travis Gibbons has been using LabChart Lightning to research the effect of thermal stress (heat and cold) on physiological processes such as brain blood flow and intracranial pressure.
Brandon Bucher, Head of Research at ADInstruments shares the story behind why we have created LabChart Lightning and what scientific researchers can expect from this innovative new piece of software.