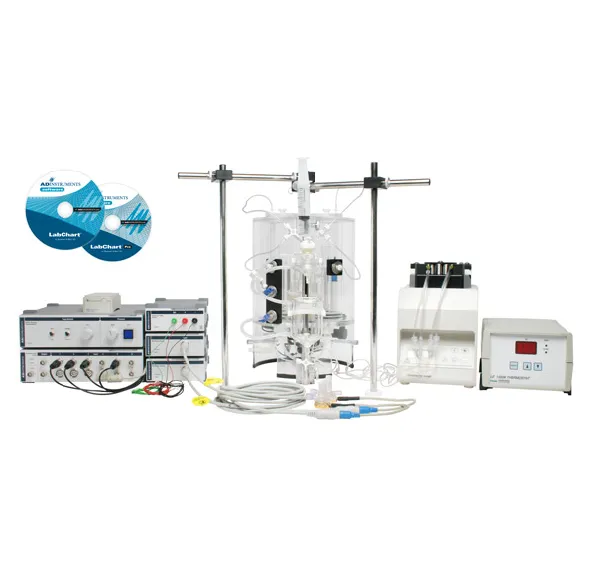

Dose Response
Dose Response Software
The Dose Response Software Module allows analysis and graphical display of dose response type data recorded in LabChart.
Download SoftwareOverview
The Dose Response Module for LabChart allows analysis and graphical display of dose response type data from LabChart recordings. Dose response analysis can be performed automatically or manually in real time as data is recorded. Previously recorded LabChart data can also be analyzed using the Dose Response Module. The results of the analysis can be exported allowing for dose response curve analysis in external programs such as Excel.
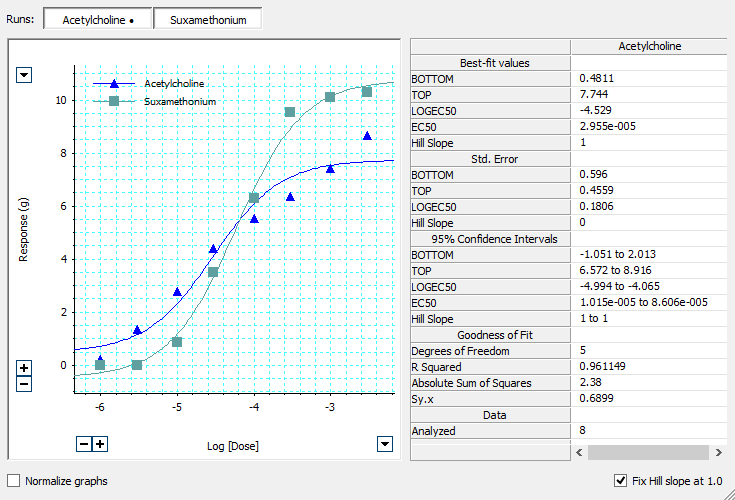
The Dose Response Module identifies response markers in the LabChart recording and uses the selected data to generate dose response curves and calculate parameters such as EC50 values and Hill slopes.
The Dose Response Module is included as part of LabChart Pro or can be purchased separately.
Related


Research Applications
Cardiovascular Isolated Heart Systems
In Vitro Pharmacology + Isolated Tissue and Organs
Working Heart
Cardiovascular Isolated Heart Systems
In Vitro Pharmacology + Isolated Tissue and Organs
Small Animal Telemetry
Animal Telemetry
Isolated Tissue Baths
In Vitro Pharmacology + Isolated Tissue and Organs
Isolated Organ
In Vitro Pharmacology + Isolated Tissue and Organs
Signals
Key Features
- Complete data acquisition and analysis systems for in vivo and in vitro dose response applications.
- Real time and offline analysis.
- Automatic and manual display of single or multiple dose response curve calculation modes.
- Calculates EC50 values and Hill Slopes.
- Extensive set of response calculation methods, based on LabChart selections:
- Average
- Maximum
- Maximum-Minimum (Response Height)
- Integral (Area)
- Minimum
- Optional baselines, flat and sloping.
- Simple, yet flexible, workflow:
- Enter a dose or list of doses.
- Mark dose point(s) on the data trace.
- Auto-analyze data or calculate responses from manual selections.
- Linked displays of Table View, Analysis View and Chart View.
- Table View provides centralized setup, display and data management functionality.
- Analysis View allows inspection and manual adjustment of calculation region and optional baseline for each response.
- Result View displays parameters of fitted sigmoid curves and provides for simultaneous display of multiple curves with optionally fixed top, bottom and hill-slopes.
- Data can be exported in XML and tab-delimited text format for use in other applications.
Support
Support Articles
Our Support Articles contain answers to common questions, how-tos, solutions, and documentation.
Training and Workshops
Maximize time and resources with our customized training services delivered at your facility, on your equipment, on your terms.
Details and Tech Specs
Technical
Compatibility
LabChart 8 for Windows | checkmark |
LabChart 8 for Mac | - |